Let’s talk about data. Data is the king of any strategy, and in today’s world, making decisions without it is like chasing dreams without a plan. But when you work with the right data? That dream starts to come true.
Here’s how I used this principle to grow my website traffic from 83,250 visitors to 308,025 visitors in just 180 days. That’s a 3.7x increase!
The Secret? It’s Simpler Than You Think

No magic formula or mysterious SEO guru involved—just good old-fashioned work and understanding what needs to be done.
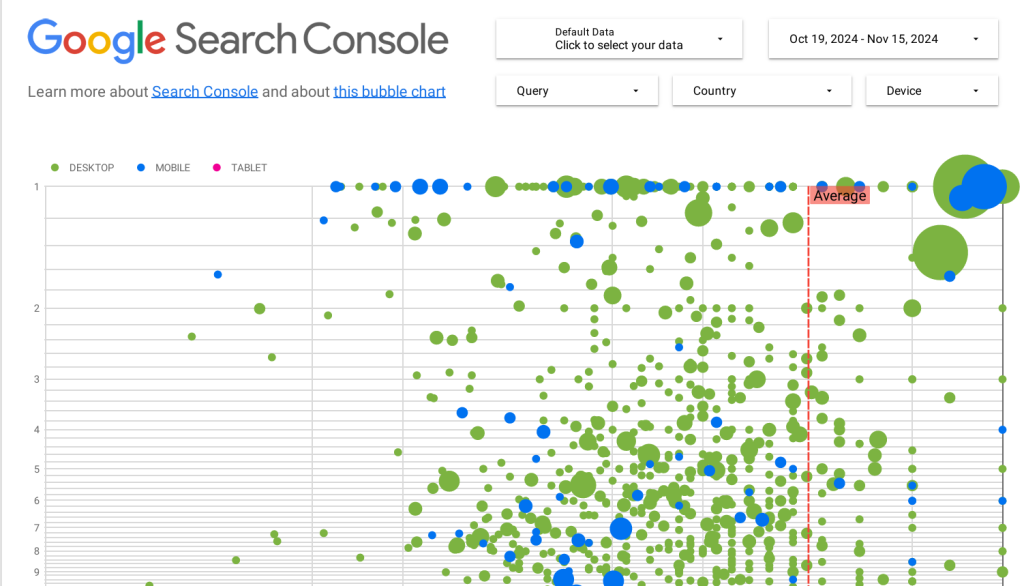
I focused on Google Search Console data for six months and took a closer look at my queries using a bubble chart analysis. By breaking down the data into actionable categories, I was able to identify where to focus my efforts. Here’s how it works:
The Four Query Categories
When you create a bubble chart, your queries fall into four performance groups. Each group tells you a unique story about your SEO strategy:
1. High Position, High CTR
These queries are already crushing it! They rank high and get a great click-through rate (CTR). The action plan? Keep doing what you’re doing—these are already optimized.
👉 Click Here to See the List of High Position, High CTR Queries of VectorSeek.com
👉 Need the High Position, High CTR Queries for your website? Get Them Now!
2. Low Position, High CTR
These are golden opportunities. Even though these queries rank lower than average, they still get clicks because they’re relevant to users.
Action Plan:
- If you don’t already have a dedicated page for this query, create one! Centralize all the information users need.
- If you do have a page, improve it with more targeted and helpful content.
👉 Click Here to See the List of Low Position, High CTR Queries of VectorSeek.com
👉 Need the Low Position, High CTR Queries for your website? Get Them Now!
3. Low Position, Low CTR
These queries need a bit more thought. They rank low and don’t get many clicks, but some of them still drive traffic. This group can be split into two subcategories:
- Related Queries: These are relevant to your site and easier to optimize since they’re already appearing in search results. Focus on these first.
- Unrelated Queries: If they don’t align with your site’s content, consider whether it’s worth optimizing for them. Sometimes, it’s better to focus on more relevant traffic.
👉 Click Here to See the List of Low Position, Low CTR Queries of VectorSeek.com
👉 Need the Low Position, Low CTR Queries for your website? Get Them Now!
High Position, Low CTR
These queries rank well but don’t get enough clicks. This could happen for several reasons:
- Competitors might be using rich snippets or structured data that make their results more appealing.
- The query might not be very relevant to your site’s audience.
- Users might already get the info they need directly from the search results, like your address or business hours.
👉 Click Here to See the List of High Position, Low CTR Queries of VectorSeek.com
👉 Need the High Position, Low CTR Queries for your website? Get Them Now!
Action Plan:
- Optimize for visual elements like structured data or rich snippets.
- Refine your titles and meta descriptions to better match user intent.
How I Applied This Insight
I categorized my data into these four groups, then took action:
- Added new content where needed.
- Tweaked existing pages for better alignment with user intent.
- Enhanced meta tags, descriptions, and headings to make my pages more appealing in search results.
And the result? A 3.7x traffic increase.

Key Takeaways
This strategy isn’t complicated. It’s all about analyzing your data, understanding what users want, and making informed changes. The tools you need—like Google Search Console and Looker Studio—are free and powerful.
Want to boost your site’s traffic? Start by diving into your query data, create a bubble chart, and see where your biggest opportunities lie.
Your success story might be just 180 days away. 😊


